Analytics
The Analytics section in Skima AI is your centralised hub for tracking recruitment performance across your entire hiring operation. It gives you real-time visibility into key metrics through role-based dashboards and fully customisable boards, designed for recruiters, hiring managers, team leads, and leadership.
Navigate to 'Analytics' from the left sidebar to get started.
Pre-Made Dashboards
When you first open Analytics, Skima AI provides ready-to-use role-based boards so you can start tracking metrics immediately without any setup.
The default boards available are:
i) CEO Analytics provides key metrics for strategic decision-making on talent acquisition, including Average Time to Hire, Open Jobs, and Total Applications.
ii) Team Lead Analytics monitors team productivity, recruiter leaderboards, and pipeline health, covering Open Jobs, Jobs Without Recent Activity, and Avg. Time to Fill by Recruiter.
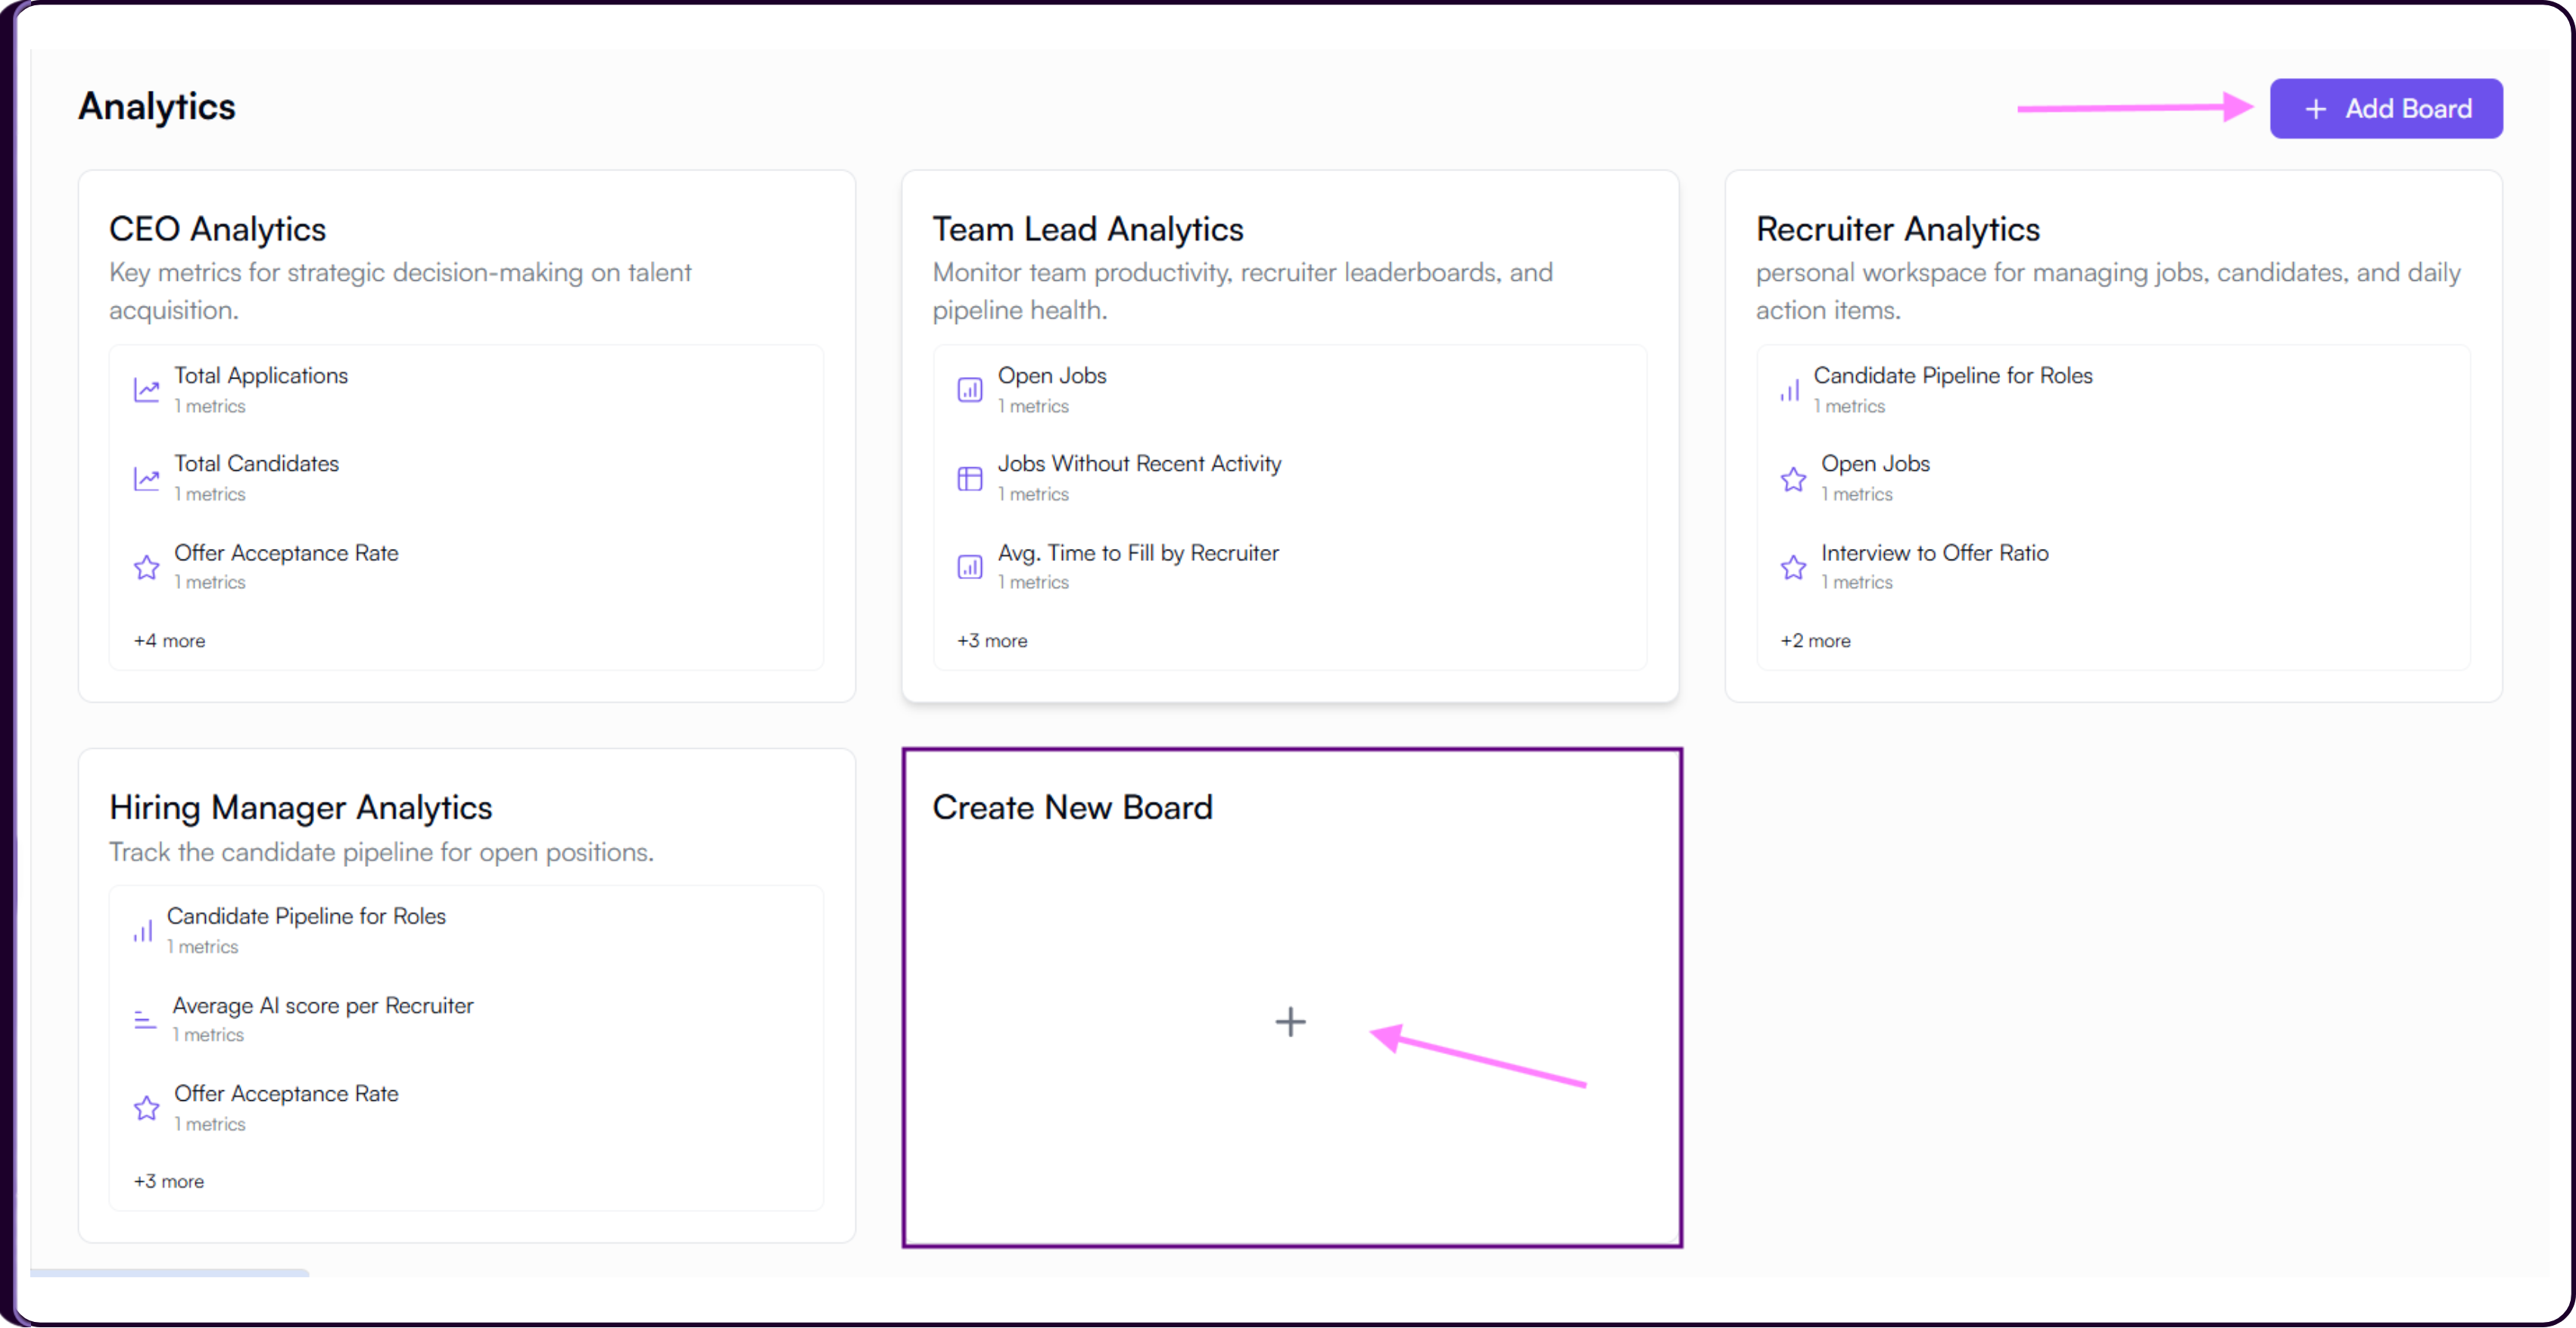
iii) Recruiter Analytics is a personal workspace for managing jobs, candidates, and daily action items, showing Candidate Pipeline for Roles, Open Jobs, and Interview to Offer Ratio.
iv) Hiring Manager Analytics tracks the candidate pipeline for open positions, including Candidate Pipeline for Roles, Average AI Score per Recruiter, and Offer Acceptance Rate.
Each board displays a preview of its top metrics on the home screen. Click on any board to open it and view the full set of cards.
Creating a New Board
You can create a fully custom board alongside the pre-made ones.
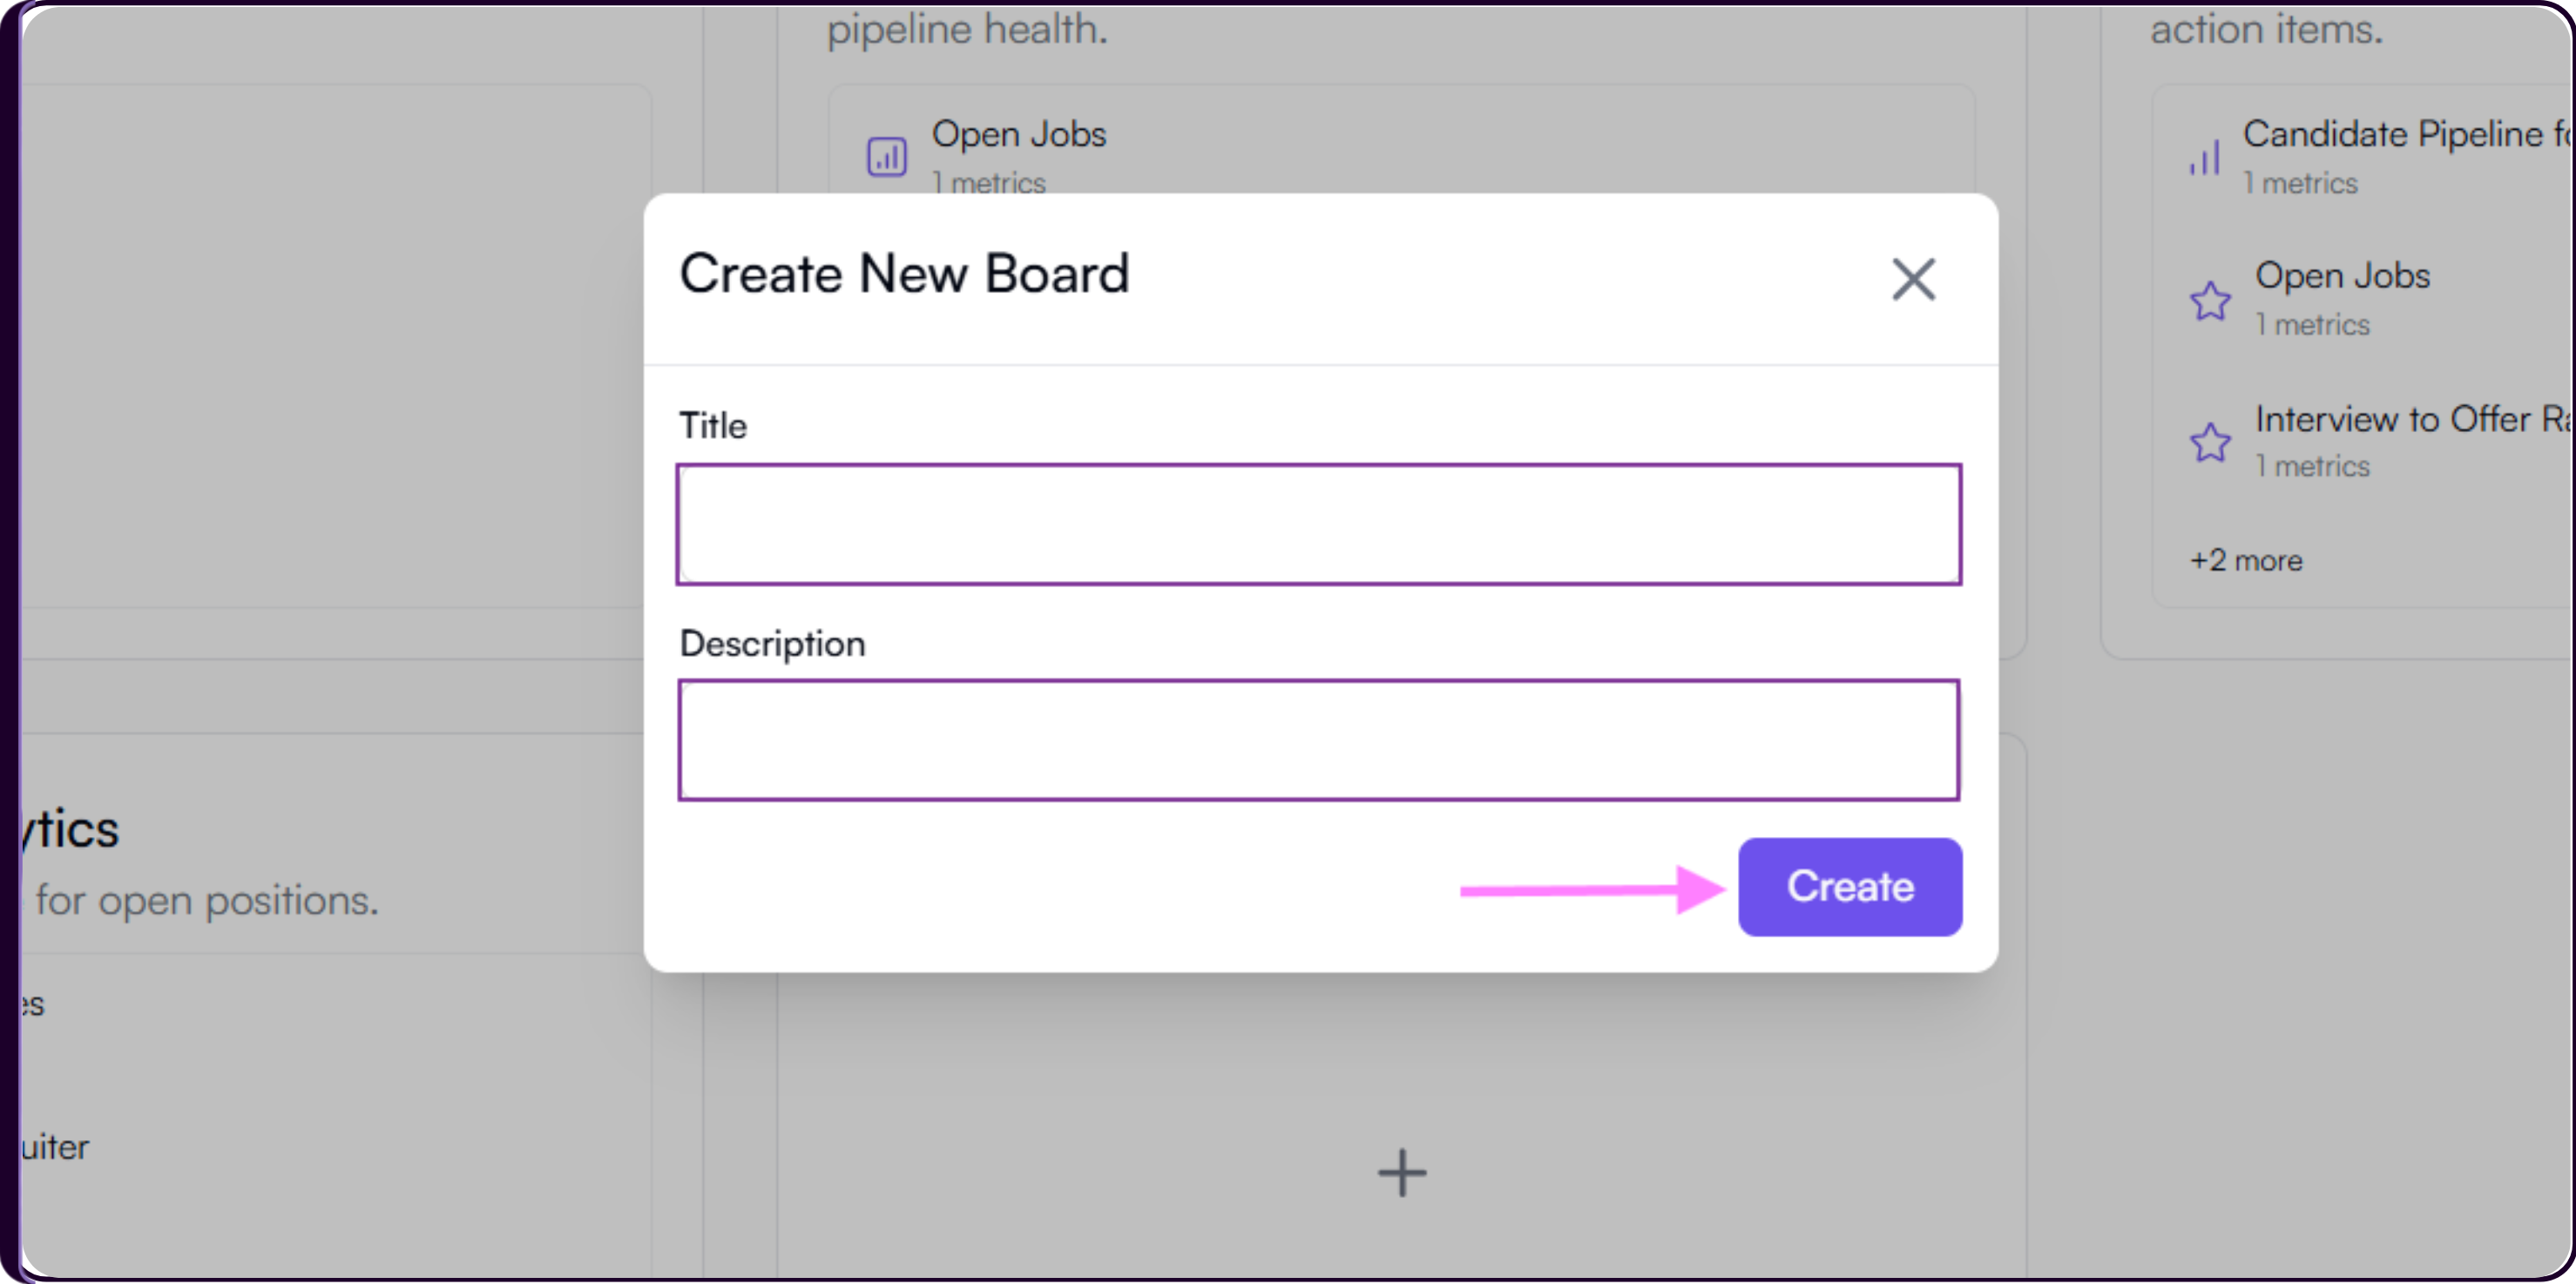
On the Analytics home screen, click 'Add Board' in the top right or click the 'Create New Board' card with the '+' icon.
A modal will appear where you enter a Title and a short Description so your team can quickly understand the board's purpose.
Click 'Create' to save it. The new board will appear alongside the existing role-based boards.
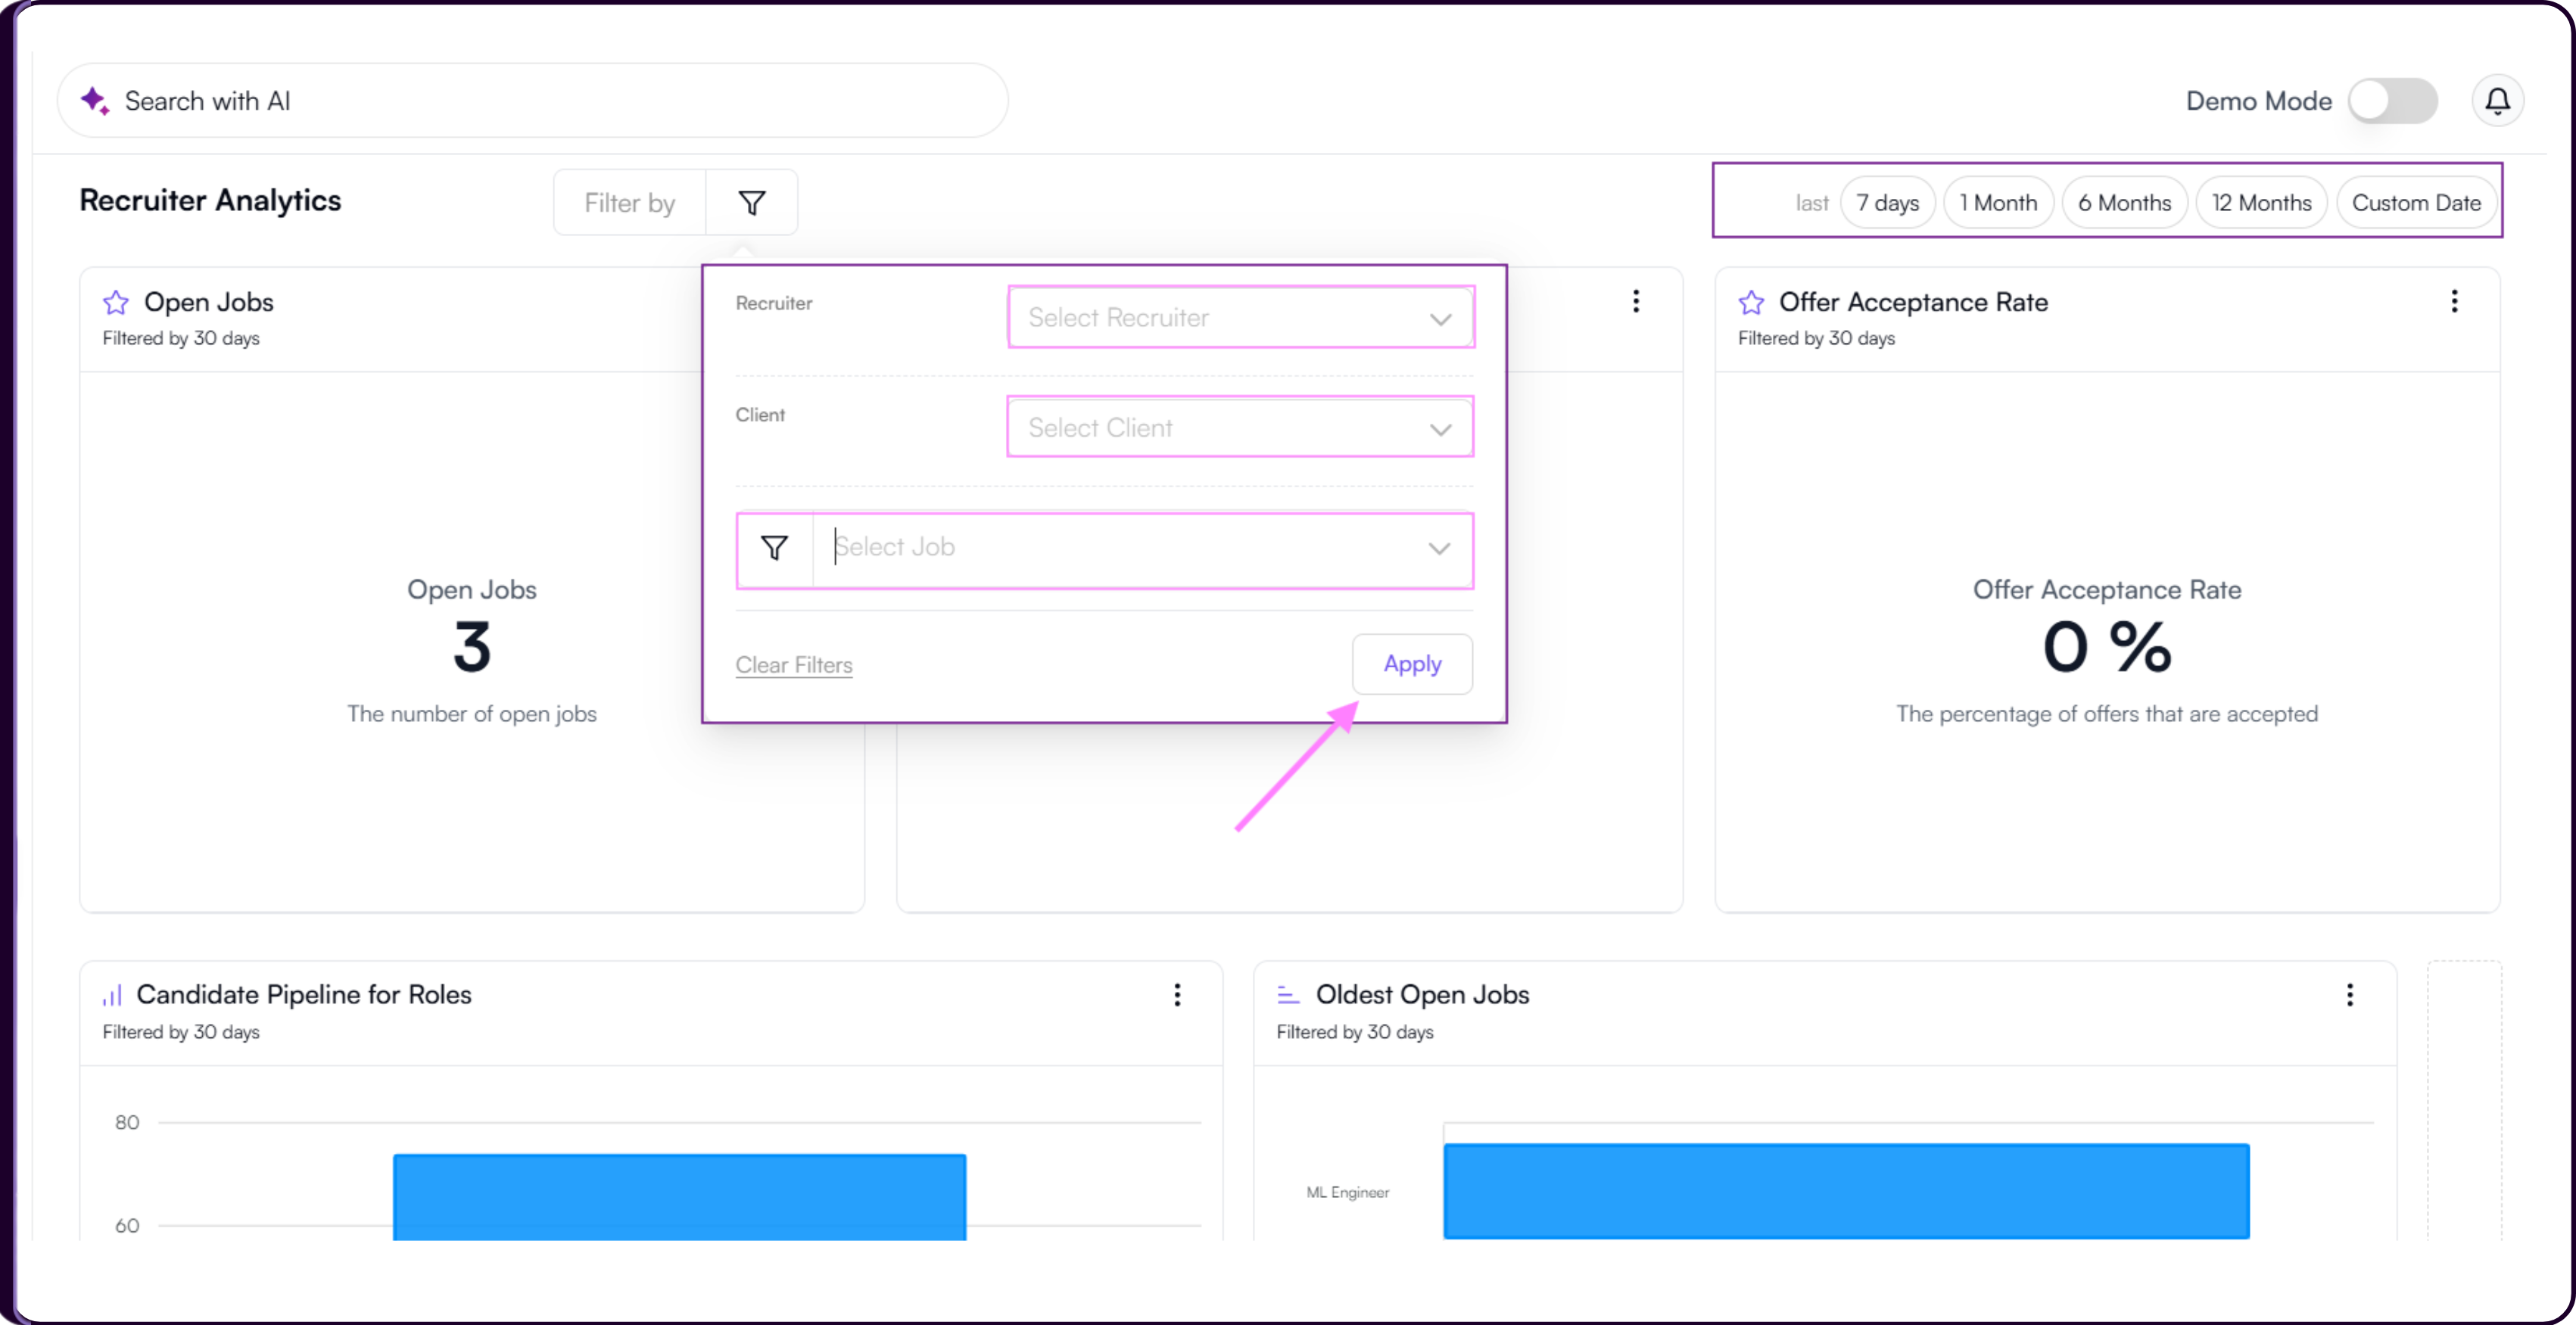
Inside a Board
When you open a board, you will see all its metric cards displayed in a grid layout.
Date Range Filter
Use the date range selector in the top-right corner to control the time period shown across all cards on the board. Available options are Last 7 Days, 1 Month, 6 Months, 12 Months, and Custom Date.
Filter by Recruiter, Client or Job
Click 'Filter by' at the top left of the board to narrow the data shown across all cards. You can filter by Recruiter, Client, or Job. Click 'Apply' to update the board instantly.
Rearranging and Resizing Cards
Every board is fully customisable. Resize any card by dragging its edges, and reposition cards by dragging and dropping them to a new location on the board. This makes it easy to surface the metrics that matter most at the top.
Creating a New Card
To add a custom metric visualisation to any board, click the '+' button on the right edge of the board. A Create Card side panel will open.
Step 1: Title
Enter a clear title that describes what the card shows.
Example: Total Applications Over TimeStep 2: Choose Data Category
Select one of the three available data categories: Application Metric, Job Metric, or Candidate Metric.
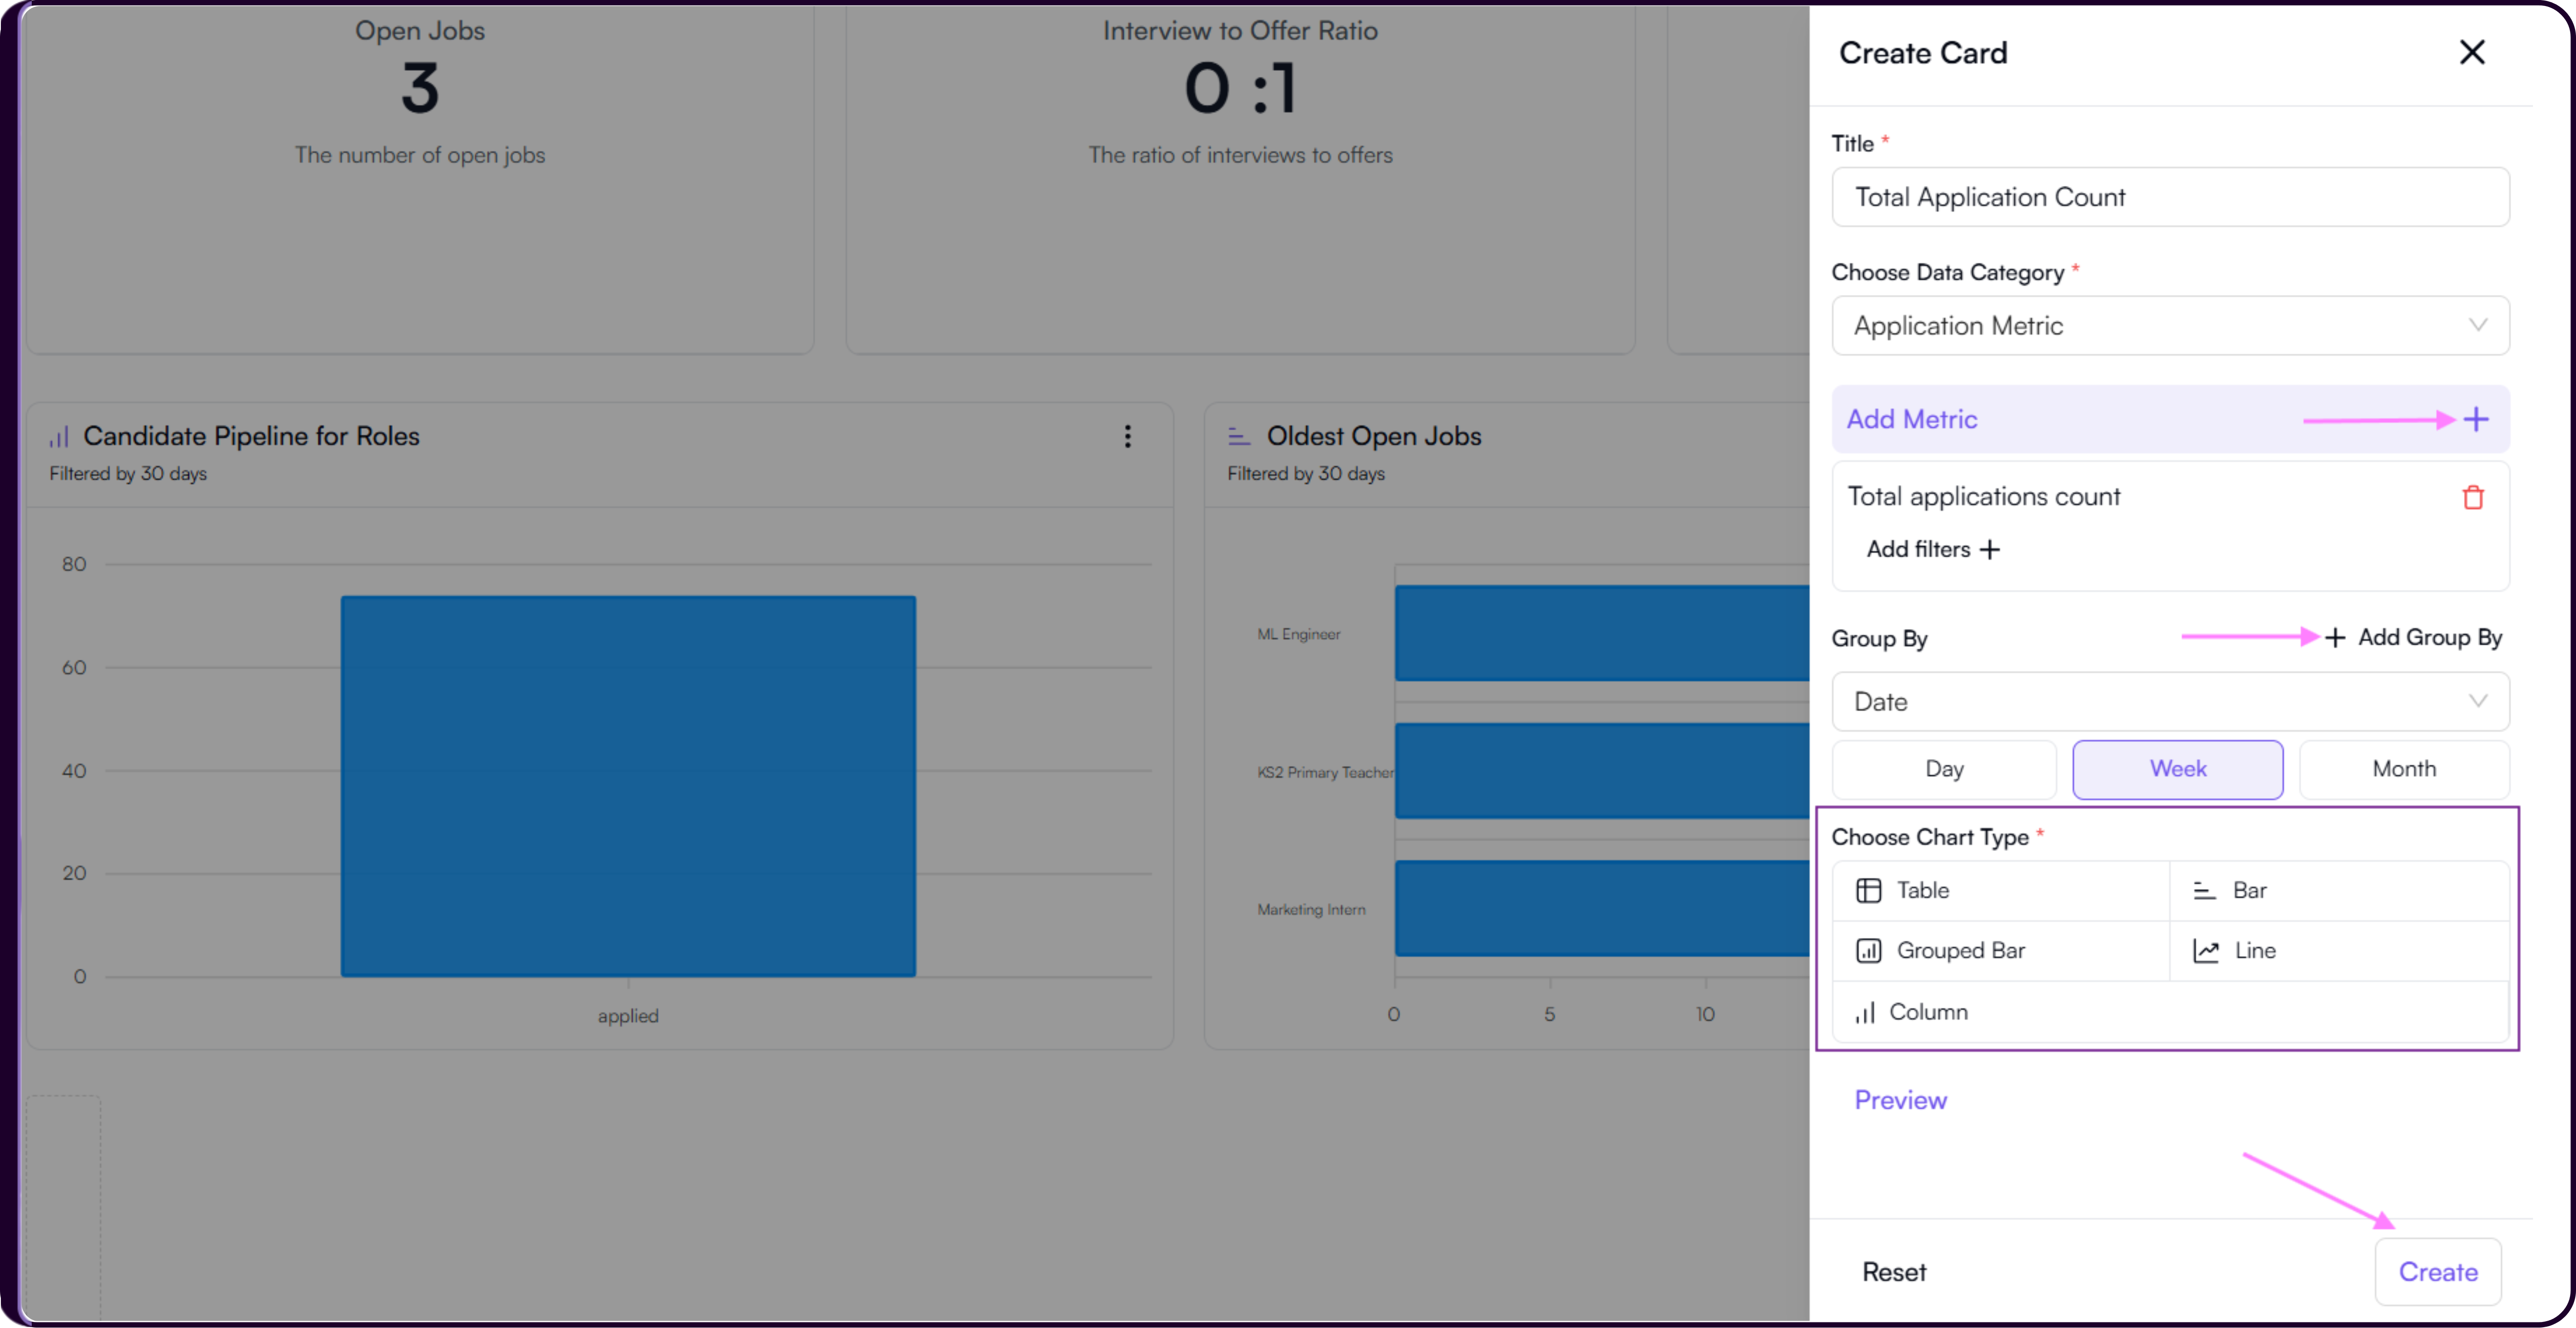
Step 3: Add Metric
Click 'Add Metric' using the '+' button to choose the specific metric you want to measure based on your selected data category.
For Job Metrics, you might pick Open Jobs Count. For Application Metrics, options include Total Applications, Average AI Score, and similar. For Candidate Metrics, you could track Total Uploaded Candidates, Upload Batches, and more.
Step 4: Group By (Optional)
Group the metric by categories such as Job Title, Recruiter, Client, Date, or Candidate Source. You can add one or multiple group-by fields depending on what you are analysing.
Step 5: Choose Chart Type
Select how the data should be visualised. Available options include Table, Bar Chart, Grouped Bar Chart, Line Chart, and Column Chart. Chart type options become available after selecting a data category.
Step 6: Preview and Create
Click 'Preview' to see how the card will look before saving.
- If satisfied, click 'Create' to add the card to the board.
- If you want to start over, click 'Reset' to clear the form.
Managing Existing Cards
Each card has a three-dots menu (⋮) in the top-right corner. From here you can:
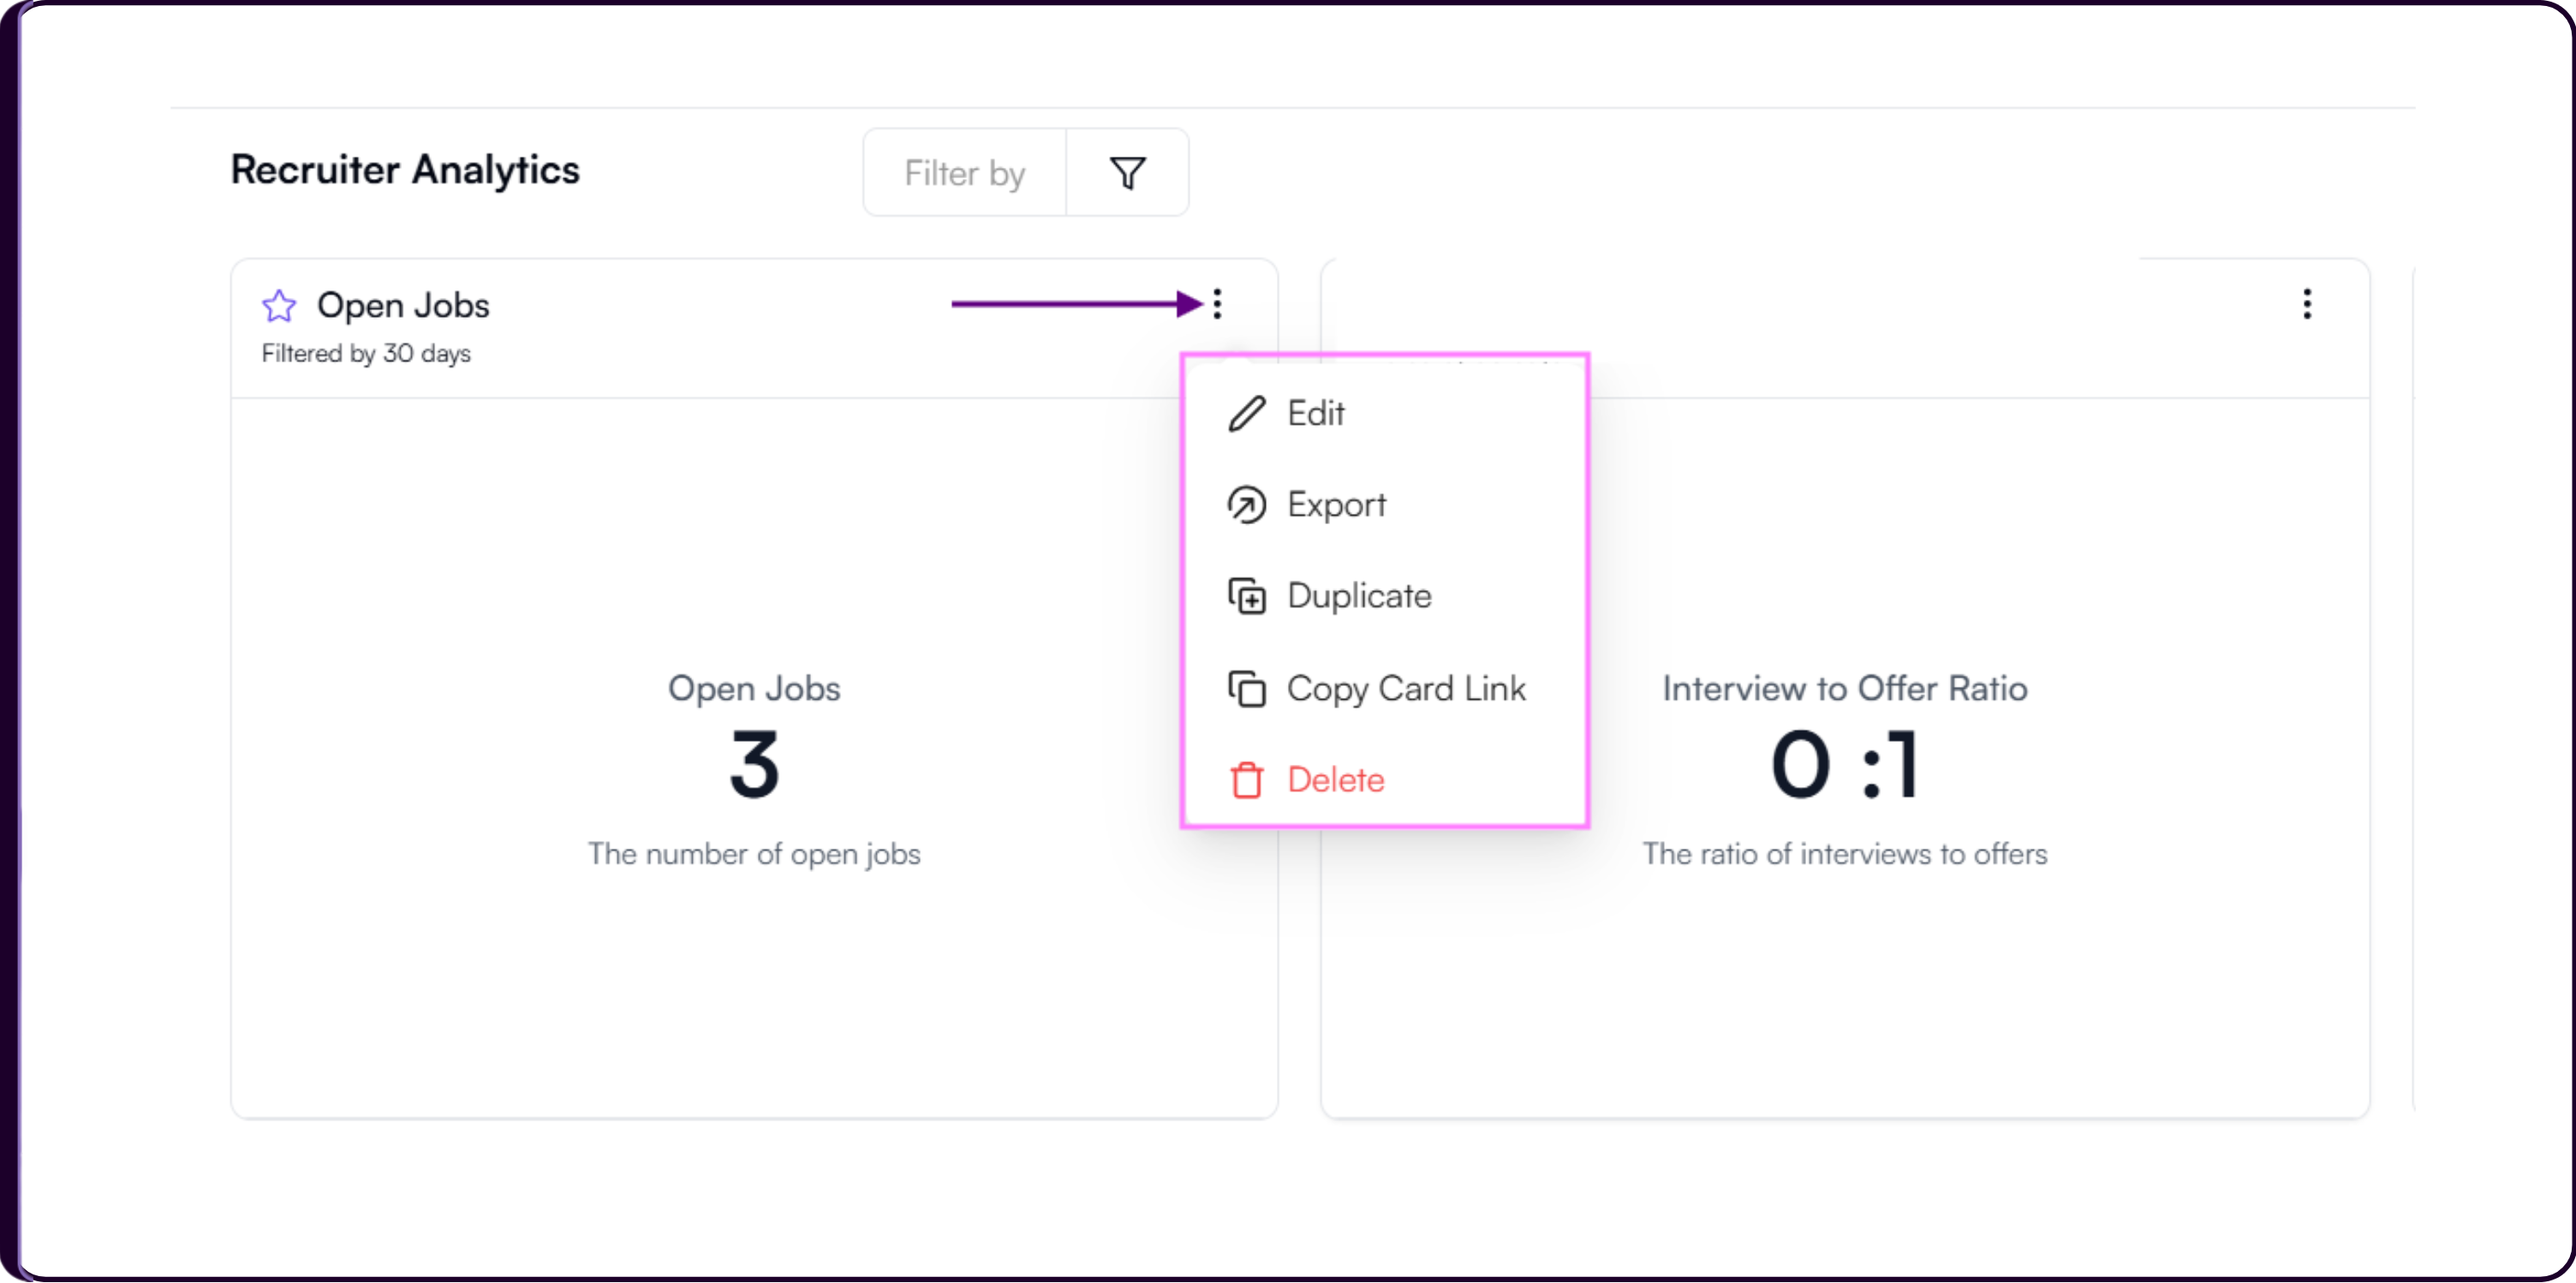
- Edit to reopen the configuration panel and update the card
- Export to download the card data as a CSV file
- Duplicate to create an exact copy of the card on the same board
- Copy Card Link to generate a shareable link to that specific card
- Delete to permanently remove the card from the board